
Use the expression plotter to analyse your design in more detail. You can build an expression using placed probes, nets, or both.
Entering an expression
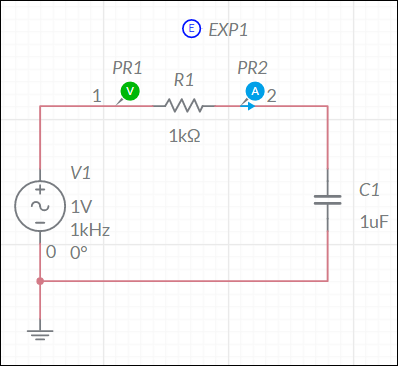
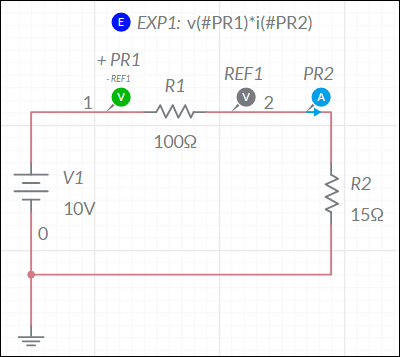
This example uses an RC filter with placed voltage and current probes.
- Place an expression plotter from the Analysis and annotation sub-palette onto the workspace (EXP1 in the example below).
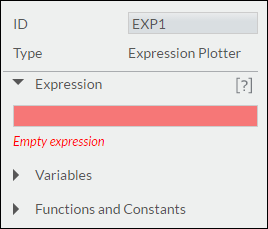
- Double-tap on the expression plotter to open its properties and tap in the Expression field.
The next steps show you how to enter the sample expression v(#PR1)*i(#PR2). - Type "v". Matches display as follows:
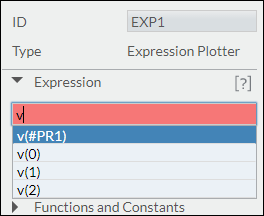
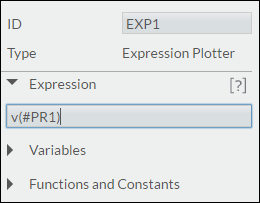
- Tap the desired match.
You can also continue typing to narrow the available matches in the list. - Type "*" (multiply).
- Type "i" and tap i(#PR2) in the list. Notice that the Expression field and EXP1 on the workspace display the expression.

- Select simulation type and simulate.
This example uses transient simulation. The expression plotter results relate to the unitless right y-axis. There can be more than one right y-axis. In the example below, there is also a Current (A) y-axis for PR2.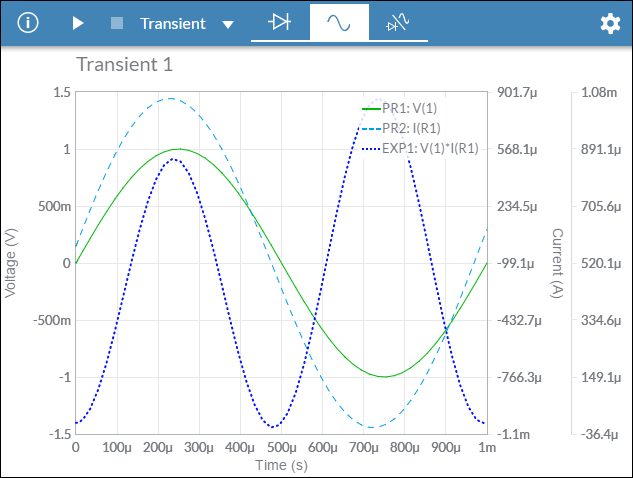
Tip. To avoid simulation errors and unexpected results, do not build expressions that are likely to result in divide-by-zero conditions.
Variables and Functions and Constants lists
You can also use the Variables and the Functions and Constants lists to build the expression.
Filter the Variables list from its drop-down. Select All, Probes or Nets. The list of Variables only includes nets with components attached, for example, a net placed on the workspace between two junctions, with no attached components.
Filter the Functions and Constants list from its drop-down. Select All, Algebraic, Relational, Logical, Trigonometric, Constant, Exponential, and Complex.
After filtering a list, double-tap the desired item to insert it into the equation.
Example - calculating DC power through a resistor
The expression in the following design calculates the DC power through R1 by multiplying the voltage across R1 by the current v(#PR1)*i(#PR2).
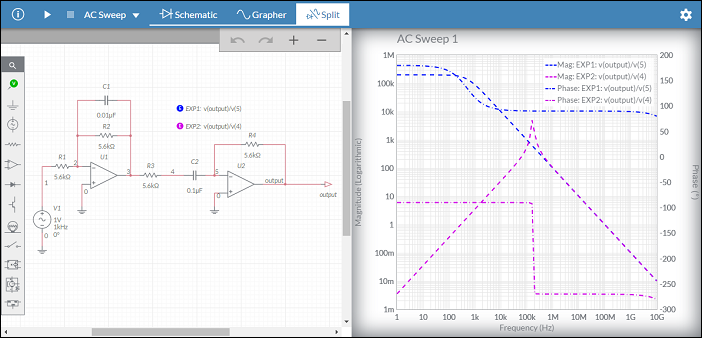
Example - cascade filter
The expressions in the following design compare the gain before and after C2. The expressions' magnitude and phase for varying frequencies is displayed in the AC sweep results to the right.
Related Information
Expression plotter functions
Comments
0 comments
Please sign in to leave a comment.