
DC sweep performs a sequence of DC operating point simulations. It increments the voltage or current of a selected source in predefined steps over a range of values. DC sweep can be used with any source that includes a DC offset variable.
An optional second source can also be used to run a nested sweep.
During simulation:
- Capacitors are treated as open circuits.
- Inductors are treated as short circuits.
- Only DC values of voltage and current sources are used.
Sweeping a single source
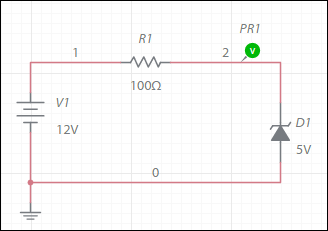
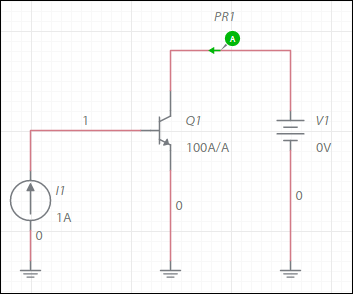
The following is a simple Zener regulator circuit where the diode maintains a nearly constant breakdown or Zener voltage as the current through it changes. In this case, the Zener voltage is 5 V.
You can build this circuit, or open it from the Help Circuits user group and save your own copy. This is a closed group. You can open and copy the circuits in this group, but you cannot join it.
Set up and run the sweep:
- Build the above circuit.
- Tap
 , expand Simulation settings and select DC sweep.
V1 is automatically selected as the source. - Enter a Start value of 0 V, a Stop value of 10 V, and an Increment of 1 V.
Notice that Points are set to 11. If you change the Increment value, the number of points will change accordingly. - Tap Start simulation.
The grapher opens with the following results: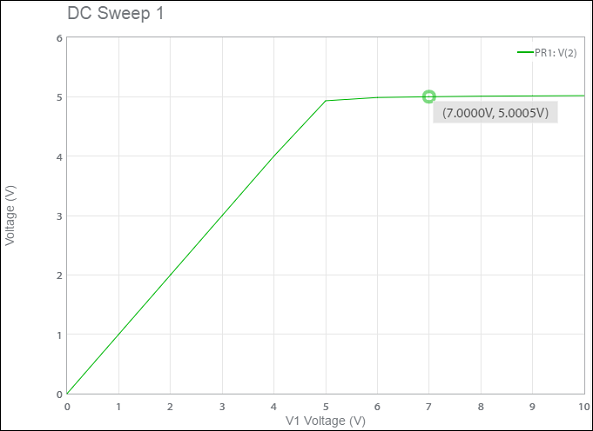
The sweep parameters were set so that datapoints were measured at 1 V intervals, for example, the selected datapoint above (7.0000V, 5.0005V).
Notice that the output voltage stabilizes at approximately 5 V as expected.
For a smoother curve, enter a smaller Increment, for example, 0.1 V, which will yield 101 datapoints.
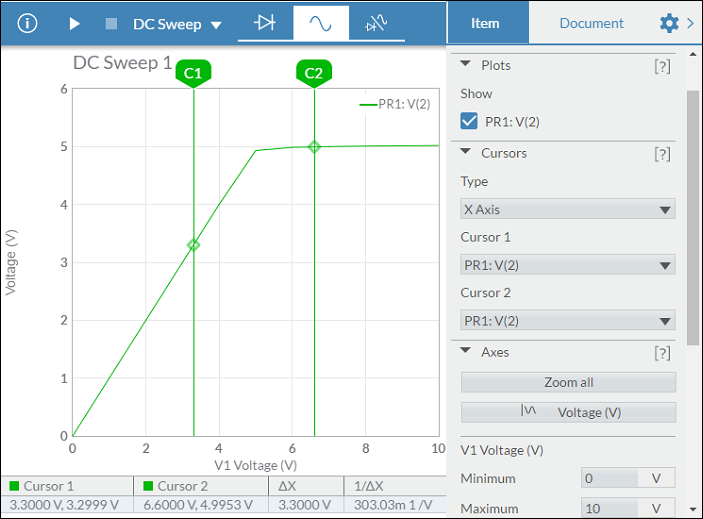
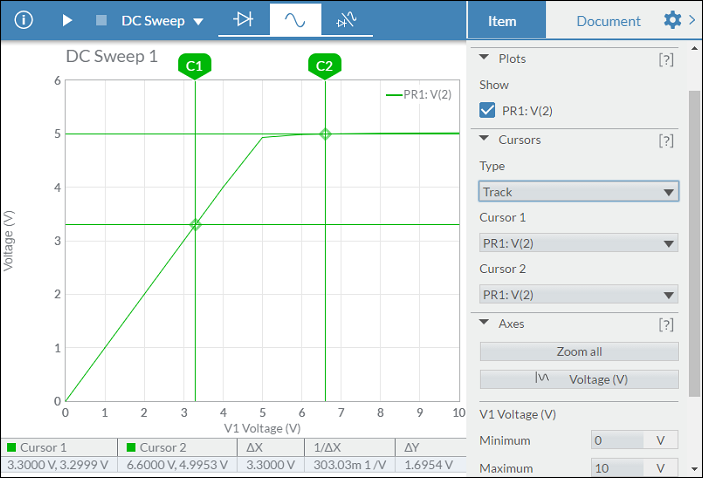
CursorsYou can switch on cursors to get more information. X axis, Y axis and Track cursors are available for DC sweep simulation.
In the following example, X Axis is selected from the Type drop-down menu, in Cursors.
The table displays the X and Y axis values for Cursor 1. Similar values are displayed for Cursor 2.
The third column of the table displays ΔX = X2 - X1.
The fourth column displays 1/ΔX.
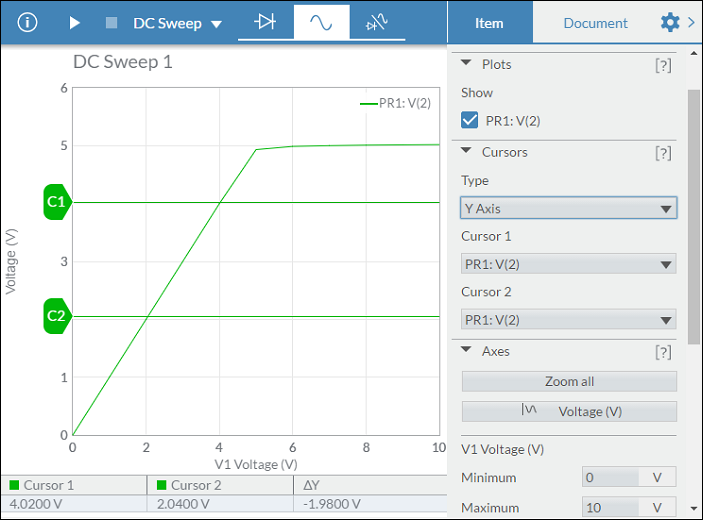
Notice how the data in the table changes when you select Y Axis for the cursor Type:
When Track is selected as the cursor Type, the table contains data similar to the following:
Nested sweeps
Nested sweeps are useful for measuring a transistor's characteristic current-voltage, I-V, curves, as demonstrated below.
You can build this circuit (I-V curves), or make a copy of it from the Help Circuits user group.
Set up and run the sweep:
- Build the above circuit.
- Tap , expand Simulation settings and select DC sweep.
- Select V1 as Source 1 and set the following:
Start value 0 V
Stop value 10 V
Increment 0.5 - Select I1 as Source 2 and set the following:
Start value 0 A
Stop value 0.00025 A
Increment 0.00005 A - Tap Start simulation.
The grapher opens with the following results.The legend includes the component that was swept and its Start and Stop values.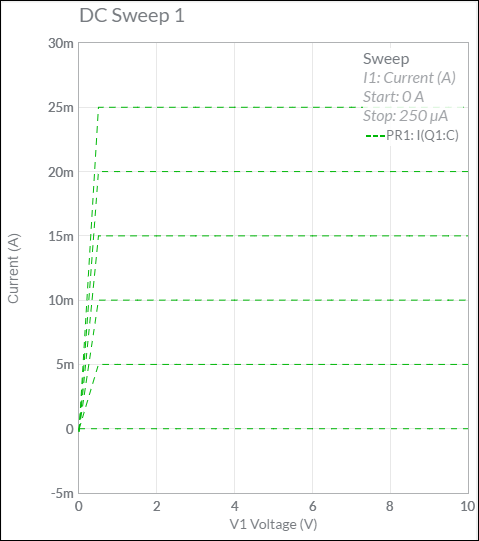
Each curve represents one value of Source 2 (I1). The 0 A curve was generated by its Start value of I1 = 0 A.
The next curve was generated when I1 incremented to 5e-05 A. Hover the cursor over a trace to read its datapoints. The data label shows the value of Source 2 in the title.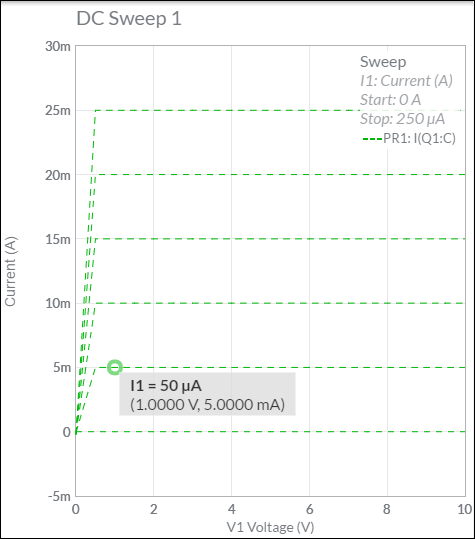
Cursors
You can switch on cursors to get more information. X axis, Y axis and Track cursors are available for nested DC sweep simulations.
In the following example, X Axis is selected from the Type drop-down menu, in Cursors.
The table displays the X and Y axis values for Cursor 1. Similar values are displayed for Cursor 2.
The third column of the table displays ΔX = X2 - X1.
The fourth column displays 1/ΔX.
You can change which of the nested sweeps a cursor reads by selecting it from the second drop-down. In the example below, Cursor 1 reads the data from PR1 for the sweep when I1 = 0 A.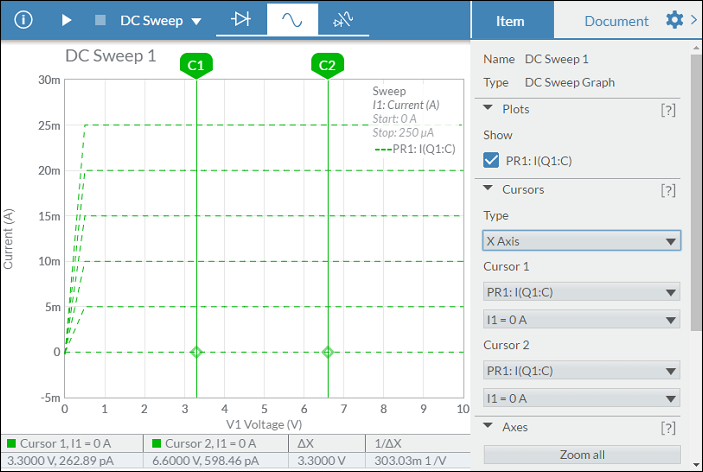
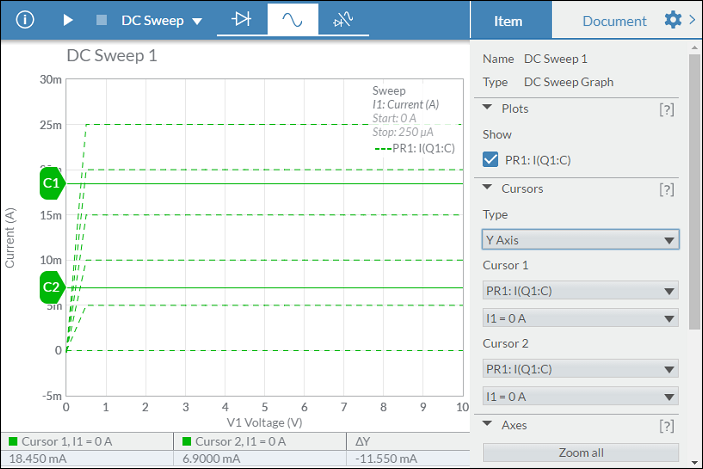
Notice how the data in the table changes when you select Y Axis for the cursor Type:
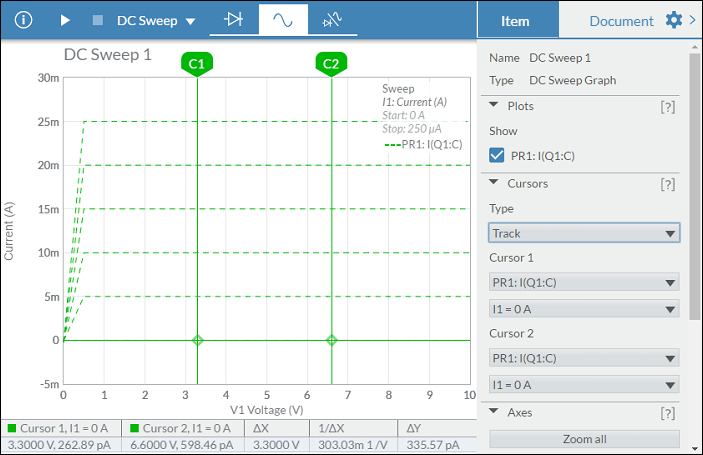
When Track is selected as the cursor Type, the table contains data similar to the following:
Comments
0 comments
Please sign in to leave a comment.